Who Are the Russian Trolls?
It is currently under investigation whether during the 2016 U.S. elections a Russian ‘troll factory’, the Internet Research agency (IRA) based in St. Petersburg, released a number of tweets from fraudulent Twitter accounts. These tweets potentially influenced the population of voters by spreading divisive statements, some of which were fake news. The aim of this analysis is to better understand the strategy of the trolls by retrieving the main subjects of these tweets over time and categorizing them according to their targeted social, geographical, or political group. Quantifing the potential impact of those tweets and providing a link to specific events that were occuring in the United States at the time are the objectives. All analyzes are provided with interactive plots to stimulate future research.
Introduction
On October 7th 2016, the Department of Homeland Security and the Director of National Intelligence (ODNI) stated that the American Intelligence Community was certain that the Russian Government had interfered with the U.S. election process through a number of strategies with the intent of damaging Hillary Clinton’s presidential campaign. Examples of such strategies include, but are not limited to, directed hacking of Hillary Clinton’s personal google email account and the broadcasting of fake news via social media accounts. In early 2017, the ODNI stated that the Russian president Vladimir Putin personally ordered this ‘influence campaign’ to harm Clinton’s chances and thereby increase the chance of the election of a president more favorable to Russia.
The Russian internet trolls targetted a number of social media services such as Facebook and Twitter. This analysis will consider data only from Twitter. The dataset is provided by FiveThirtyEight and comprises a number of features, including but not limited to, author name, content (the tweet itself), language, date, followers and account type. A second dataset is used as supplementary material and includes other features that will be incorporated into the analysis such as the number of likes for a given tweet. We expect the types of accounts to differ in activity and subject matter depending on the timeframe. The analysis will attempt to dig deeper into the strategy of these Russian trolls.
Languages
An analysis of the types of languages that were tweeted reveals that Russian and English are the main languages. Interestingly, Spanish appears to be negligible even though it is the second most prominent language in the United States. The reason for this remains unclear. Considering the fact that English is spoken by 72% of individuals in the U.S. and that Russian tweets would not be able to get through to the American population in general, our project focuses only on the tweets written in English. The following plot shows the most common languages. The legend is ordered from most to least frequent language.
Account Categories
Following the work of Linvill and Warren, the Russian Trolls can be clustered into a few different account categories:
- Right Troll: nativist and right-leaning populist messages, conservatives ( #tcot #ccot) and Trump related, uniformly supporting Trump after his nomination as the republican candidate.
- Left Troll: socially liberal messages, cultural identity, gender and sexual identity (#LGBTQ), religious identity (#MuslimBan) and racial identity (#blacklivesmatter). As stated by the authors these tweets aimed to be divisive and against Hillary Clinton.
- NewsFeed: mainly directed towards local news posting, these trolls targetted specific U.S. citizens and incorporated real local news services. They are characterized by names such as @OnlineMemphis and @TodayPittsburgh.
- HashtagGamer, Fearmonger, Commercial and NonEnglish are others categories that have not been analyzed because of the relatively small amount of data available as well as the fact that they are less relevant to our research question.
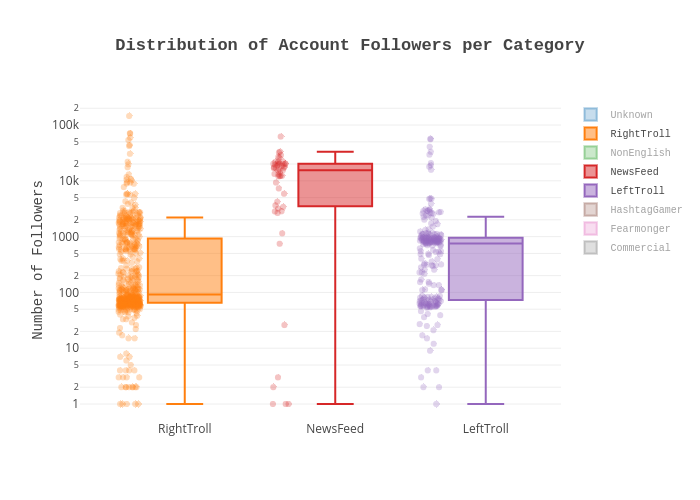
The plot below shows the distribution of followers for each account category. Notably we can see that many authors (especially left and right trolls) did not manage to reach a high number of followers with respect to the NewsFeed category. Additionally, we must consider the fact that the trolls could follow each other to give credibility to their accounts. Hence, knowing that the total number of unique trolls appearing in the entire FiveThirtyEight dataset is 2848, accounts with more that 2848 followers strongly suggest that they may be followed by also true American citizens. To further support this hypothesis, higher densities of accounts both at 1000 and 100 followers are visualized on the boxplot, suggesting that this log-bimodal distribution might not be due to true American Twitter accounts, but from an organized entity.
Modelling Topics
In order to gain a better understanding of what the Trolls were posting about, a neural network was trained to recognize 10 topics that we deemed to be the most dominant based on the most common hashtags. This is hence a supervised learning approach. The neural net was implemented in PyTorch and trained using Google CoLab’s Tesla K80 GPU. The net has three hidden layers - the first, second and third layers have 6000, 1000 and 100 neurons, respectively. The model was shown to have an accuracy of 85% through an evaluation on a test set. The list of topics is given below. Try hovering over the topic description for a graphical representation of the most tweeted words in a given topic.
Trump. Include any reference to Trump
Trump Adversaries. Include references to any political figure against Trump. Tweets in this category are commonly against Hillary Clinton or Obama.
Black. Include any reference the African-American population. It is mainly related to the #BlackLivesMatter movement
Patriot. Includes tweets related to support of the NRA,the army and conservative movements.
Crime. Involve a type of criminal offense
Sports. Includes any sports-related activity including events related to games, players and coaches.
Entertainment. Include events related to celebrities, music and sometimes controversial topics.
Health. Includes tweets related health in general such as health insurance, going to the gym and food.
Islam. Involves anything against Islam, notably ISIS and bombings that occured internationally.
Foreign Countries. Includes tweets interested in international affairs and world news.
Timeline Insights and Quantifying Success
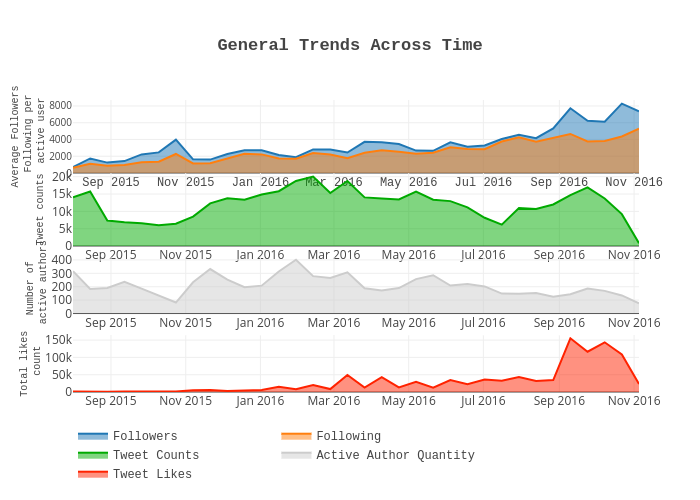
From the following plot, it is clear that the general increase in followers cannot be attributed to an increase in tweets, nor increase in active authors. What could the increase in followers be attributed to? Are they real people? Or perhaps they are the Trolls themselves, including bots that may have been set up? To help answer this question, the statistics on the number of ‘likes’ were retrieved. ‘Likes’ have the potential to be considered as an indicator of Troll success - i.e. if they were able to get through to the general public. Here we see that the number of ‘likes’ skyrockets from 50,000 to 150,000 at the start of September, 2 months before the election. These numbers make sense, as there is an increase of approximately 200,000-400,000 followers in total during this period.
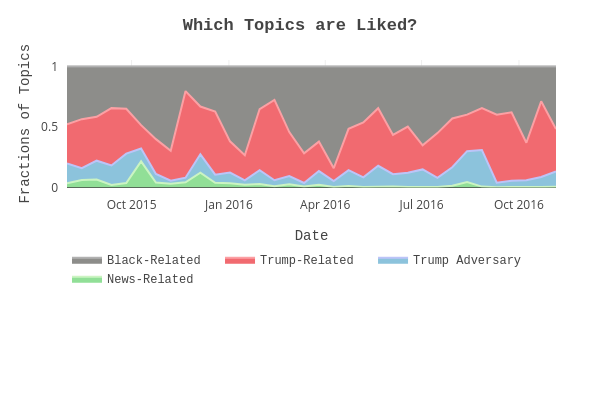
To better understand what topics were being ‘liked’, the model for topic prediction was applied. The graph below shows the proportions for the most dominant topics over time. However, we are most interested in the period between September 2016 to the date of the election, since this is when ‘like’ counts reach their highest numbers. Here it is shown that the majority of ‘likes’ were attributed to topics related to the election such as Trump-related, Black-related and finally to smashing Trump adversaries (including Clinton and Obama), interestingly the news related tweets did not receive any significant increase in likes. Had these ‘likes’ been caused by bots, it would have been likely to see an increase in ‘likes’ that are not catered to a specific topic but rather distributed among all Troll tweets. Since practically no ‘likes’ were given to News-Feed topics, it may be less likely that the ‘likes’ are fake, and are rather related to real Americans who turn their interest towards politically-related topics.
Potential Strategies for Gaining Influence
The Trolls may have been able to gain the attention of the masses via various strategies.
Targetting Events and Subpopulations
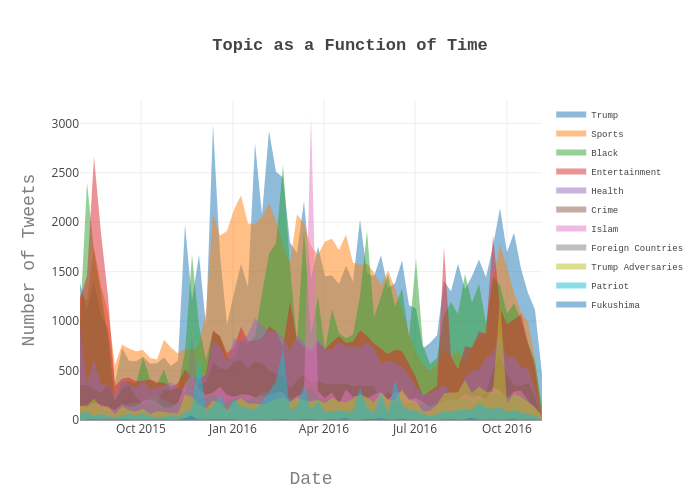
- One strategy was through exploiting popular and controversial events that occured either in America or internationally. As can be seen in the line plot below, which ranges up to one year before the presidential election, there are distinct spikes that can be shown to be correlated to events by examining the tweets in the specific time periods. Examples include the following for the most followed accounts:
- On November 11th 2015, there is a spike in the topic Foreign Countries. From inspection of the tweets, this is most likely attributable to the coordinated terrorist attacks that took place in Paris.
You may not be at war with Islam, but Islam is at war with you #ISIS -JENN_ABRAMS
- During the week of February 29th 2016, there is a peak in the topic related to African-Americans. The Oscars ceremony of 2016 was supposedly a very controversial ceremony, due to the fact that there were no black actors that were nominated. The Russian Trolls took advantage of this event to gain potential followers.
#OscarsSoWhite REALLY?? #Oscars -JENN_ABRAMS
- On March 19th 2016, there is a sharp increase in the topic Islam. This is the date of the bombing in Brussels, which is believed to have been related to ISIS. Tweets related to this event show strong anti-immigration sentiments.
No equality. No freedom. Just violence, civil war and terrorism… Do we need this to happen in America? -PIGEONTODAY
- On September 26th, the Trump Adversary topic sees its greatest spike. This was coincidently the date of the first presidential debate between Donald Trump and Hillary Clinton.
This is not a misspell on Hofstra University’s debate tickets It’s the name of Hillary’s body double #debatenight -JENN_ABRAMS
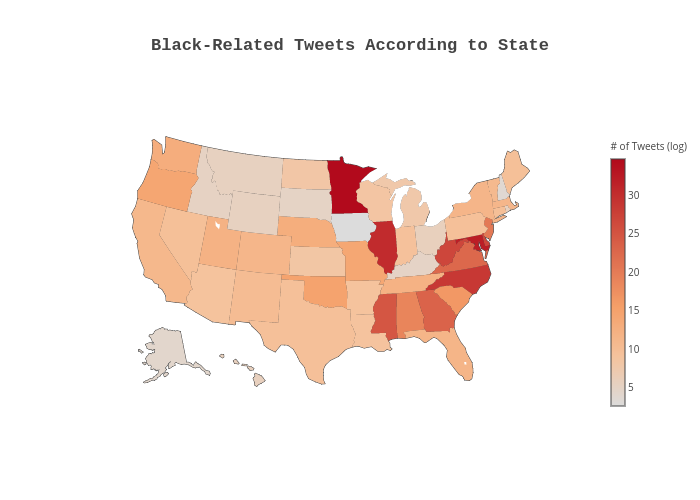
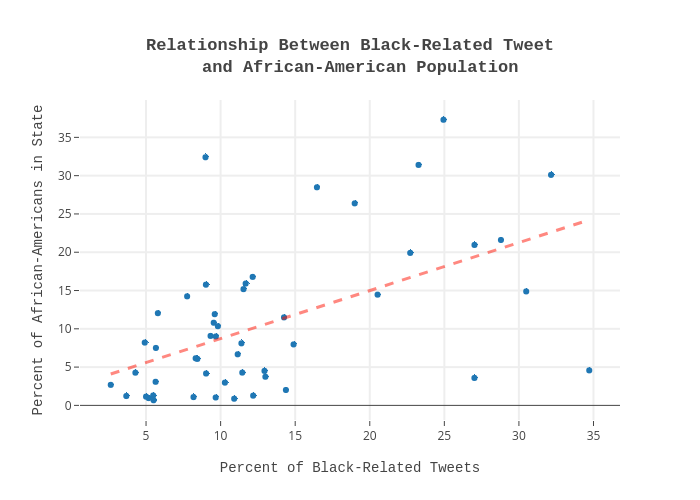
- A second strategy includes targetting specific populations of people. One of the most prominent that was found was that of the African-American population, which is a politically relevant community. When topic categorization was applied to analyze the types of tweets that were being released, the states with higher percentages of African-Americans, as determined by the U.S. census of 2010, correlated with the percent of Black-related tweets that were released by the Trolls.
A pearson correlation coefficient of 0.52 is obtained when quantifying the relationship between the percentage of African-Americans versus the percent of Black-support topics in that state. This implies that there is a statistically relevant relationship between these two variables, and that the Trolls may very well have considered the African-American population of states when releasing tweets. Furthermore, it validates the ability of our topic categorization model to accurately classify the Black-related topic.
-
One approach that had racked up a large quantity of followers was the creation of twitter accounts that impersonated a seemingly real individual rather than accounts named in a news-related fashion. A notable example is the author JENN_ABRAMS, a Troll account which was depicted to be a woman in her 30’s that supported Trump. This account managed to attain a maximum follower count of 61759 during the period under inspection.
-
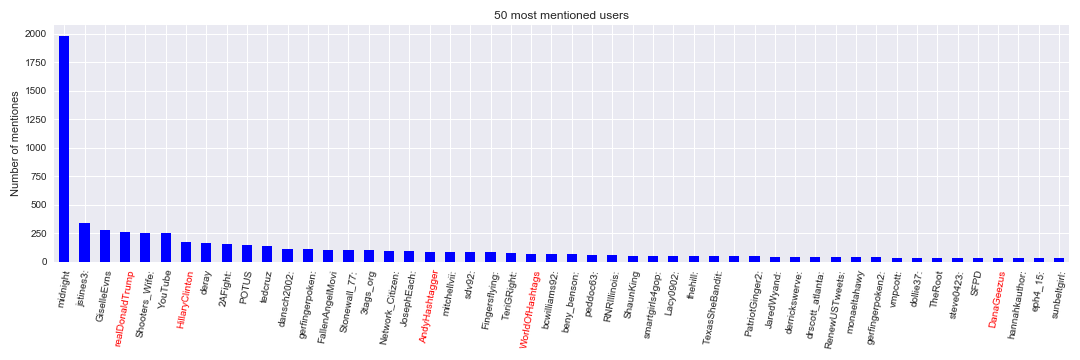
Another potential strategy that we investigated was the act of replying to popular Twitter authors such as @midnight that are followed by a significant proportion of the American people. However, given the fact that only individuals who follow both the Troll who replied and the author to which the reply was made can see the reply, this tactic may have not been the best in terms of gaining an audience. For this reason the number of replies remains relatively low. The analysis was conducted by extracting unique users that were mentioned in tweets and quantifying their occurences. It also appears that trolls do not tend to mention eachother - only 13 trolls were shown to name another fellow troll. The accounts belonging to these 13 trolls are categorized as HashtagGamer. Additionally, other than the leading 3 trolls, they are mentioned less than ten times.
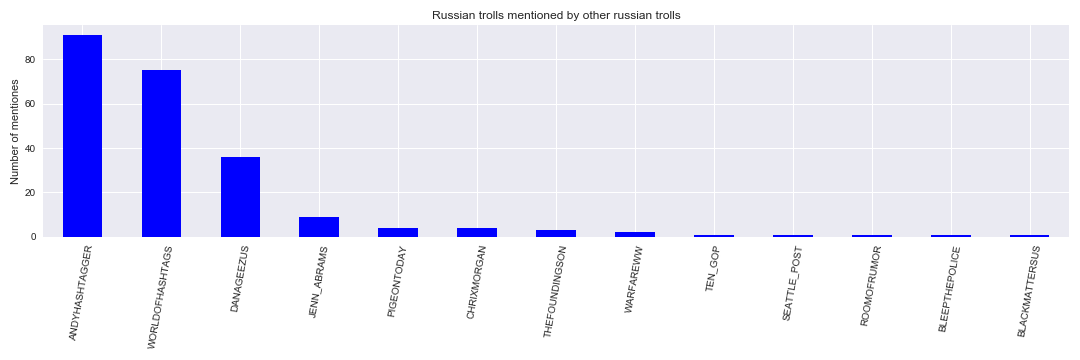
For the top 3 users, the 10 tweets with the most replies, likes and retweets were analyzed. These tweets did not have a particular “trolling” message. Additionally, some of the tweets were identical for all users, with tweets such as: “#ThingsIWontBelieve this church sign (link to picture)” and “#IHatePokemonGoBecause There will be more distracted drivers”.
Only in the 10 tweets with the most replies did we see some tweets with a political side such as:
Obama is elected the 3rd time #MakeMeMadIn5Words
and
Why? And when will my people learn? Whites can’t be trusted #IStartCryingWhen
and
#GrowingUpWithObama watching his ugly daughter in all networks
It should be noted that when the tweet ‘Obama being elected for the 3rd time’ was investigated, two of the users tweeted it at the same exact time. This lead to further inquiries which are discussed in the following section. By plotting the histogram of all the users mentioned by the trolls, it becomes evident that the most frequently mentioned user is @midnight which is a late-night internet themed panel game show. Users marked in red are those which one would expect to see mentioned (Donald Trump, Hillary Clinton) and the 3 trolls mentioned by other trolls. What we noticed is that in contrast to our expectation they did not mention Hillary Clinton nor Donald Trump all that much (around 200 tweets out of more than a million).
Identical Tweets and Different Authors
We were interested to see if tweet contents are repeated several times. In order to do so, the data was filtered to only contain tweets that were not labeled as a retweet. The findings were that there are 16,707 tweets that appear more than once in the entire dataset, while there are 27 tweets that appear more than 15 times. The following analysis focuses on these 27 tweets.
We were interested in quantifying the difference between politically-related topics and non-politically related topics with respect to duplicate tweets from distinct authors. We show that politically-related tweets tend to have larger numbers of distinct authors that post them, while non-politically related tweets tend to stick with a single author. The distinct dates that the tweets were released were also kept track of.
As the tweets are too long to show on any figure we created the following mapping:
- Tweet 1: NewsOne Now Audio Podcast: Bishop E.W. Jackson Calls #BlackLivesMatter Is Movement “Disgraceful”
- Tweet 2: Honor scores #sports
- Tweet 3: SE Wis. road construction projects #Wisconsin
- Tweet 4: Celebrity style: Red carpet looks #celebs #news
- Tweet 5: Daily Celebrity Watch #celebs #news
- Tweet 6: RT @thehill: Trump repeatedly interrupted by protesters shouting #BlackLivesMatter
- Tweet 7: On the Air #sports
- Tweet 8: Judge Rips Media
- Tweet 9: RT @RNRIllinois: Remember Kids. Dont do CNN. Its a gateway Station that leads to other Liberal media. #RedNationRising #tcot #PJNET
- Tweet 10: Winning numbers drawn in ‘Triple Chance’ game #Texas
- Tweet 11: RT @jstines3: It’s not CLUMPS of TISSUE that move and smile and react! #DefundPP #PPSellsBabyParts #TCOT #CCOT #PJNET
- Tweet 12: TV/radio schedules #sports
- Tweet 13: GUIDE: What’s up in Pittsburgh this weekend? #entertainment
- Tweet 14: #local #news AZ365: Arizona life 2016
- Tweet 15: RT @mitchellvii: Dear #BlackLivesMatter: If you act in life as you acted at the Trump Rally, it ain’t the white man who’s holding you back
- Tweet 16: Biggest and best upcoming events around Phoenix #events
- Tweet 17: *RT @RNRIllinois: In this figure you can see how Socialism works at the Beach. #RedNationRising #tcot #FeelTheBern #UniteBlue #PJNET
- Tweet 18: RT @hannahkauthor: Some media are showing(manipulating and controlling) #Election2016 polls to confuse voters? #TGDN #PJNET #TCOT
- Tweet 19: RT @peddoc63: Closest we have EVER been to Ronald Reagan is @tedcruz
- Tweet 20: #politics How your U.S. lawmakers voted
- Tweet 21: RT @josephjett: #Dependency on govt handouts, #welfare #affirmativeaction equate to #slavery We must say, Never Again! #BlackTwitter
- Tweet 22: RT @tedcruz45: @tedcruz just knocked it out of the park at #CRconvention and won a LOT of votes in #SCPrimary! #TedCruz2016 #CruzCrew #PJNET
- Tweet 23: RT @hannahkauthor: Just because he is the head of the Catholic Church, he is always right? #TGDN #PJNET #MakeAmericaGreatAgain @realDonaldTrump
- Tweet 24: RT @jstines3: Cruz fights DC Cartel EVERY DAY, not just during Campaigns! #WakeUpAmerica #CruzCrew #TrusTed #TCOT #PJNET
- Tweet 25: RT @angelacarwile: .@cristinalaila1 @TRUCKITRICH Or what about the people harassed by #BlackLivesMatter?⏩@LorettaLynch Not an issue to you?
- Tweet 26: RT @mitchellvii: #BlackLivesMatter is like a 24/7 advertisement for what a HORRIBLE DIVIDER Obama has been. Thanks guys, that much stupid
- Tweet 27: RT @JaredWyand: Ive had death threats by HUNDREDS of #BlackLivesMatter activists this year Ive killed 0 people #IslamIsTheProblem
A scatter plot visualizing the number of distinct authors as a function of number of distinct dates for each tweet was generated. By extracting tweets which appear at least 5 times (869 tweets) and by applying the topic categorization model to classify political (Trump-related, Trump adversaries, patriot, Black-related, Islam and foreign countries) versus non-political (sports, entertainment, health, crime) tweets we were able to increase the number of samples in the scatter plot.

The scatter plot indicates that there is a difference between political tweets and non-political tweets with respect to the amount of distinct authors. A statistical test for significance using the Wilcoxon signed-rank test on the difference between the two classes based on number of distinct authors resulted in a p-value of 1.50e-09.
A potential hypothesis for the fact that politically-related tweets tend to have multiple authors is that the trolls may have been instructed to release a given tweet. As all political tweets have less than 20 distinct dates we believe they are coordinated to some extent.
Targetting Specific States
- There is a particular interest in the swing states, as they include the population of voters that are not necessarily sure for which candidate to vote. The forecast of which states will be swing states in a given year is based on historical trends. For this reason they are considered by many to be the most relevant states to pursue during presidential campaigns. The definite and potential swing states of the 2016 U.S. election were forecasted to be:
- Colorado
- Florida
- Iowa
- Michigan
- Minnesota
- Nevada
- New Hampshire
- North Carolina
- Ohio
- Pennsylvania
- Virginia
- Arizona
- Georgia
- Oregon
- Wisconsin
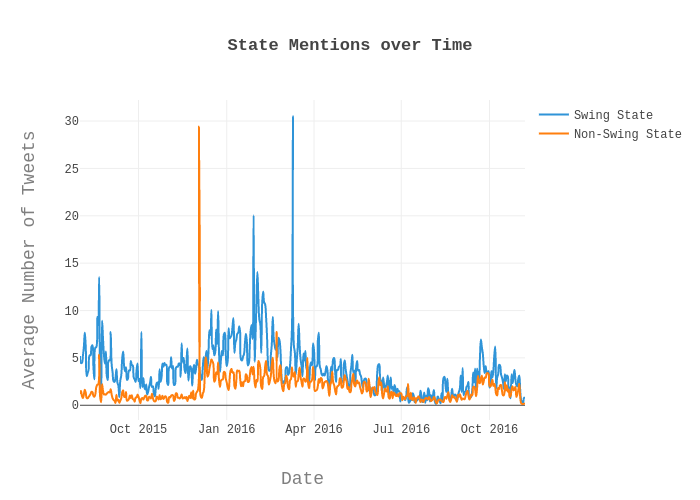
- In order to gain a better understanding of how the swing states may have been targetted, the tweets mentioning any of the swing states including the names of cities within them were filtered and counted over time. This was then compared to the trends of all non-swing states. The average value for the tweets per day for swing states is 90, while that of non-swing states is 57. A Wilcoxon test was performed due to the non-normal distribution of the data and results in a p-value of 6.15x10^-41. Note that the line plots are normalized by number of states that make up the data of a given line - e.g., the sum of tweets for the swing states in a given day are divided by 15 since there are 15 swing states.
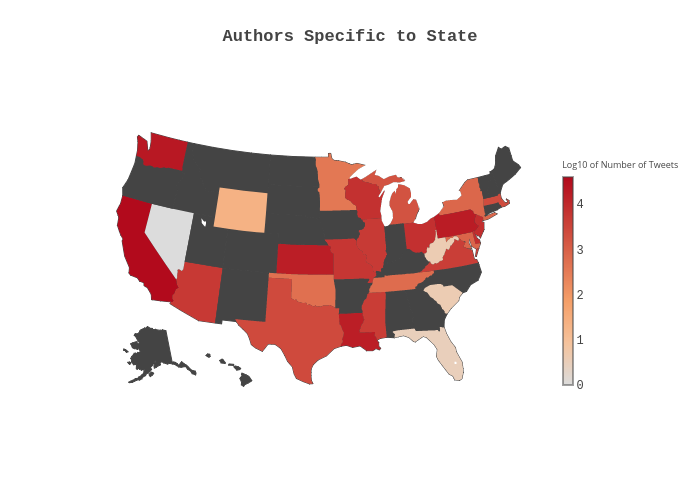
- From inspecting the names of the most active authors, it became clear that there are a number of author names which come across as neutral, news-related feeds. Examples of these include HOUSTONTOPNEWS and DAILYLOSANGELES. It is reasonable to assume that these accounts were created to target the population of cities in their respective names. In order to quantify this better, the following map was generated to visualize the number of tweets released in each state after filtering for cities and states contained in the author names. The map shows that the swing states of 2016 almost always had their own ‘dedicated’ Troll. On the other hand, several states that may not have been considered important to the Trolls did not have their own news account.
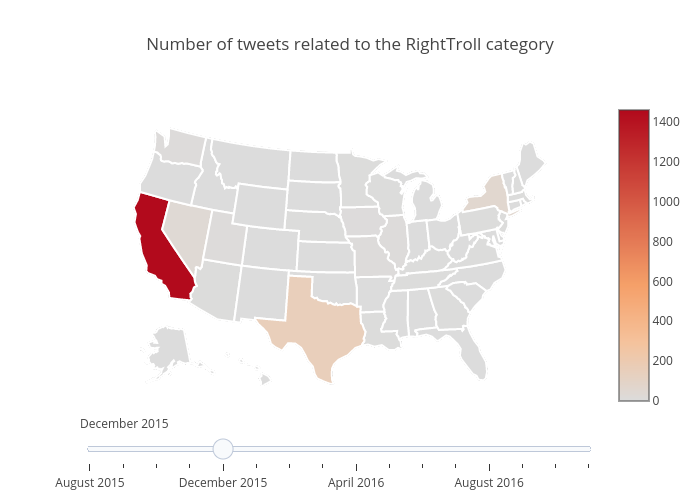
- Another analysis of the states over time was performed by classifying the account category as ‘Right Troll’ or ‘Left Troll’. For each month in the dataset we filtered the number of tweets for each account category mentioning specific states or cities within those states. The interactive maps for the Right Trolls and the Left Trolls can be found below. There are two findings of this analysis. One finding is that the Right Trolls generally did not take advantage of specific state-related events to tweet about, while the Left Trolls did (albeit to a limited extent). It may be more likely that the trolls were more interested in events that occured throughout the country in general, rather than filtering for state. Another finding is that events that trigger Right Trolls to tweet have the opposite effect on Left Trolls and vice versa.
- Regarding the states, there was one event that caused a particularly massive outbreak of tweets from the Right Trolls. This event occured in December 2015. Inspection of the maps in this period reveals that there were 1460 tweets concerning California released by the Right Trolls and only a single tweet released by the Left Trolls. During this month a mass shooting and an attempted bombing occured in San Bernardino, California resulting in 14 killed and 22 seriously injured. The perpetrators were a married couple of Pakistani descent. It seems logical for the RightTrolls to tweet about this attack and use it to promote right wing agenda. Notably, the single Left Troll tweet was completely unrelated to this event, concerned about the Mosque Fire in Coachella. The RightTroll tweets contained sympathetic tweets such as:
- Examples of anti-gun law tweets
My heart goes out to the victims who were not so lucky #Prayers4California”
as well as:
#SanBernardinoShooting displayes how inept and clueless anti-gun lawmakers are. #Prayers4California
and:
Guns are our friends because in a country without guns, I’m what’s known as “prey.” All females are. #Prayers4California
- Criticism of the Obama administration
Under Obama administration mass shootings happen every month! He wants to cover his ass with gun control! #Prayers4California
and:
#ObamaLogic: we can’t defeat ISIS? We definitely must ban guns #Prayers4California
- Anti-muslim sentiments
#GunControl but not Muslim control? Jihad a part of Islam when not raping 6 yr old girls #Prayers4California
- Examples of anti-gun law tweets
- Left Trolls were in a sense less extreme, but more consistent. With a maximum of 200 tweets per state per month, the Left Trolls targetted a variety of states, including Illinois, Mississippi and Alabama. A lot these tweets were related to social justice and the Black Lives Matter movement. Examples include the following:
- For the event at Chicago Illinois in December 2015
Chicago Police Admit To Killing Innocent 55-Year-Old Woman By Accident #BlackMatters
and:
LIVE FEED FROM CHICAGO ANTI-MAYOR PRTOTEST #Chicago #Rahm #BlackLivesMatter #LaquanMcDonald #PoliceBrutality
- For the event in Mississippi that took place in February 2016. Notably a lot of these tweets were retweets or simply copies of the same tweet. This suspicious feature is analyzed in a proceeding section.
NewsOne Now Audio Podcast: Bishop E.W. Jackson Calls #BlackLivesMatter Is Movement “Disgraceful”
- March 2016 marked the day of the 1965 Selma to Montgomery (cities in Alabama) march which focuses on African-American rights
I proud to be black!!! #SelmaToMontgomery1965
and:
I’m with Martin Luther king. Support everything he proposed #SelmaToMontgomery1965
- For the event at Chicago Illinois in December 2015
- Regarding the states, there was one event that caused a particularly massive outbreak of tweets from the Right Trolls. This event occured in December 2015. Inspection of the maps in this period reveals that there were 1460 tweets concerning California released by the Right Trolls and only a single tweet released by the Left Trolls. During this month a mass shooting and an attempted bombing occured in San Bernardino, California resulting in 14 killed and 22 seriously injured. The perpetrators were a married couple of Pakistani descent. It seems logical for the RightTrolls to tweet about this attack and use it to promote right wing agenda. Notably, the single Left Troll tweet was completely unrelated to this event, concerned about the Mosque Fire in Coachella. The RightTroll tweets contained sympathetic tweets such as:
Conclusion
This analysis of the Twitter dataset provides insights into many potential strategies that may have been employed by the Russian trolls during the 2016 U.S. presidential election. We show that strategies such as gaining credibility via increasing the number of followers artificially, exploiting particular events to attain viewers, targeting the African-American population, releasing larger quantities of tweets to swing-states and re-tweeting identical tweets were all practiced tactics. Furthermore, our research demonstrates that the trolls may have been dedicated to some tactics more than others. Mentioning popular authors for example may not have been an efficient approach to gain followers, especially since it was not pursued to significant amounts. This may imply that the Russian trolls may not have had a strict plan to follow throughout the course of the election campaigns, but rather tried out a variety of strategies that appeared to work well.

